
Figure 2.
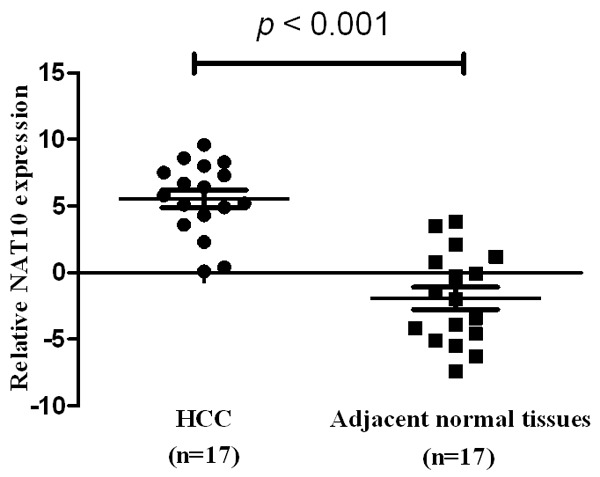
Real-time quantitative PCR analysis of NAT10 expression in HCC and adjacent normal tissue. Normalized to GAPDH mRNA levels, the expression level of NAT10 in HCC was significantly higher than the adjacent normal tissue (P < 0.001).
Official websites use .gov
A
.gov website belongs to an official
government organization in the United States.
Secure .gov websites use HTTPS
A lock (
) or https:// means you've safely
connected to the .gov website. Share sensitive
information only on official, secure websites.
Real-time quantitative PCR analysis of NAT10 expression in HCC and adjacent normal tissue. Normalized to GAPDH mRNA levels, the expression level of NAT10 in HCC was significantly higher than the adjacent normal tissue (P < 0.001).