
Figure 2.
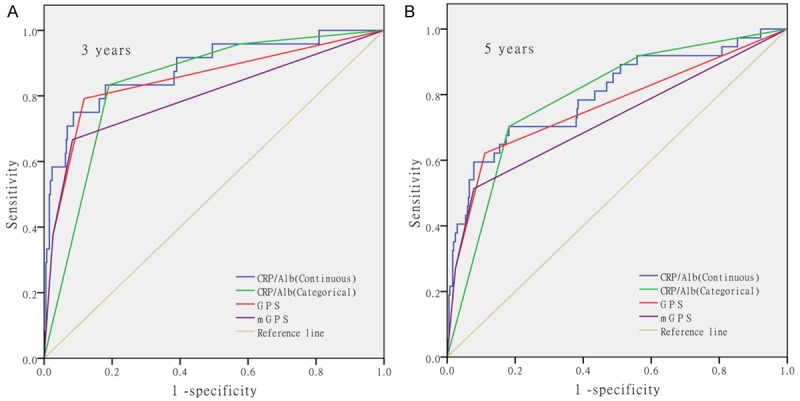
The ROC curves of inflammation-based prognostic indexes at 3 years and 5 years of follow-up. This figure showed the ROC curves of the CRP/Alb ratio (continuous), CRP/Alb ratio (categorical), GPS (categorical) and mGPS (categorical) for the survival status at 3 year and 5 years of follow-up.