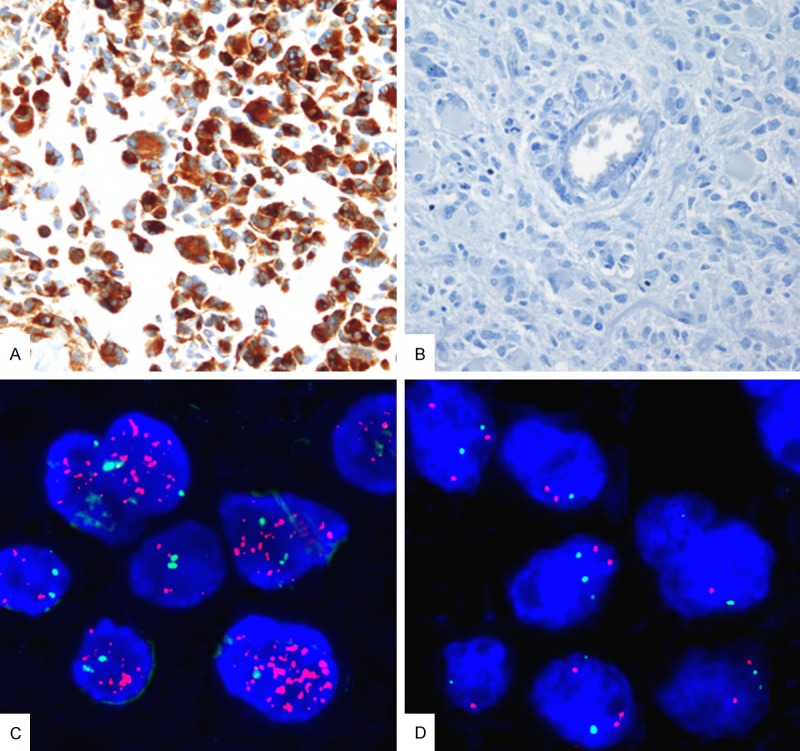
Figure 1.

Representative images of glioblastomas with (A) diffuse c-Met overexpression, (B) lack of c-Met immunopositivity, (C) MET gene amplification, and (D) no MET gene amplification. (A, B: c-Met immunohistochemistry, ×400; C, D: Labeled locus-specific dual-color Vysis probe of MET gene (7q31), spectrum orange/CEP7 Spectrum green, ×1000).
