
Figure 1.
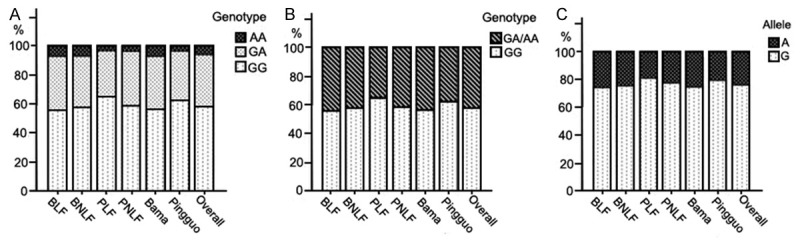
A. Comparison of genotypes among groups, x2 = 24.901, P = 0.000, between regions, x2 = 19.904, P = 0.000; B. Comparison between combined genotypes (GA/AA) and GG genotype among groups, x2 = 15.139, P = 0.002, between region, x2 = 10.288, P = 0.001; C. Comparison of allele among groups, x2 = 21.010, P = 0.000, between regions, x2 = 17.337, P = 0.000.