
Fig. 4.
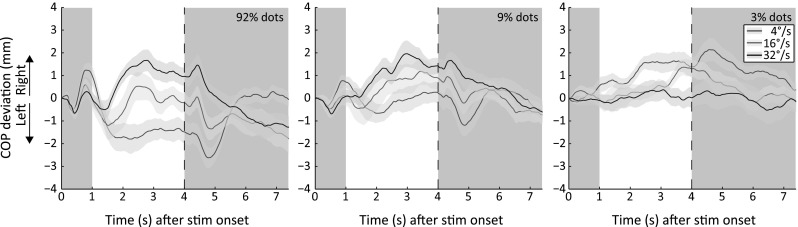
Center of pressure (COP) deviation from baseline collapsed over the three fixation dot contrasts and averaged across observers for different dot contrasts and dot speeds. For formatting details, see Fig. 1. Each panel represents the COP trajectories of each dot contrast when the COP trajectories of all fixation point contrasts are collapsed. For example, the COP trajectories of the left panel are the averaged COP trajectories of the upper panels in Fig. 2 (color figure online)