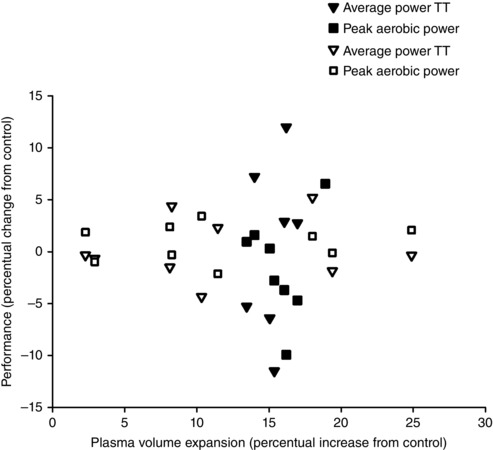
Figure 1. Changes in physiological performance capacity versus change in plasma volume .

Changes in physiological performance capacity evaluated in cool conditions (triangles representing average power output during time trials (TT) and squares representing peak aerobic power during incremental exercise testing) versus the percentage change in plasma volume following acute plasma volume expansion (filled symbols; albumin infusion) or 2 weeks of natural outdoor heat acclimatization (open symbols). The symbols represent individual values from Karlsen et al. (2015) and Keiser et al. (2015) with the delta changes calculated as the percentage increase from control.
