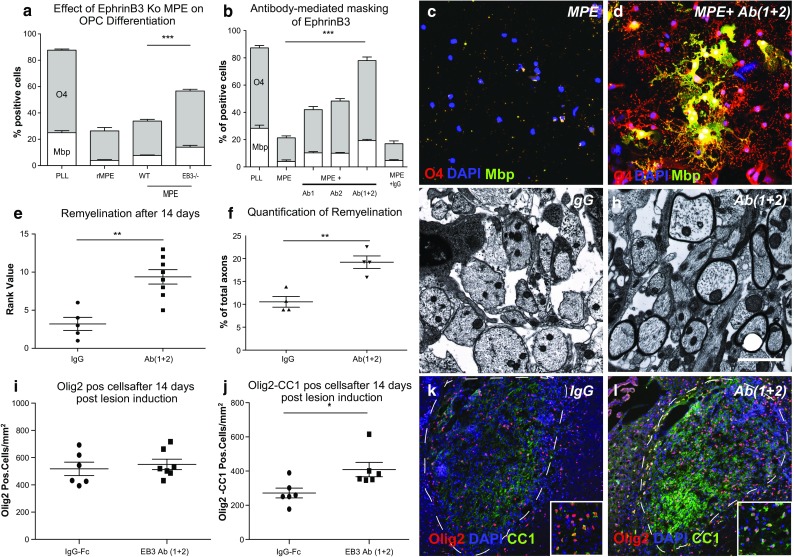
Fig. 6.

Loss of EphrinB3 and antibody-mediated masking of EphrinB3 epitopes neutralizes the inhibitory effects of myelin extracts on OPC differentiation and promotes CNS remyelination. a Bar graph demonstrating a significant increase of O4/Mbp-positive OL cells when they were differentiated in presence of MPE from EphrinB3 knock out mice in comparison to MPE from wild-type litter mates. MPE from rat (rMPE) served as internal control (2-day differentiation, n = 3; ANOVA: O4 ***P < 0.0001, Mbp ***P < 0.0001; Dunnett’s post hoc test WT-MPE vs. EB3−/−-MPE: P < 0.0001). b–d Neutralizing EphrinB3 epitopes using EphrinB3-specific antibodies (Ab1, Ab2) restored the ability of OPCs to differentiate in the presence of inhibitory MPE substrates, whereas the use of unspecific antibodies (IgG) had no effect (n = 3; ANOVA: O4 ***P < 0.0001, Mbp ***P < 0.0001; Dunnett’s post hoc test; MPE vs. MPE + Ab1 and Ab2: P < 0.0001; MPE vs. MPE + IgG; P > 0.1). e Quantitative analysis of Olig2-immunohistochemical staining cells showed comparable levels of total oligodendrocyte lineage cells in control and EphrinB3 antibodies infused lesions. f In contrast, EphrinB3-antibody-treated animals displayed increased OPC differentiation as the number of Olig2+/CC1+ mature oligodendrocytes was increased (control-IgG: n = 6, EphrinB3-Ab(1 + 2): n = 6, Student t test P > 0.05; Olig2-CC1). Representative images from control k and EphrinB3 antibody infused lesions l at 14 days post lesion induction stained for Olig2 and CC1. i Infusion of EphrinB3-specific antibodies (Ab1 + 2) into CCP lesions also accelerated CNS remyelination as evident from the rank analysis 14 dpi [control-IgG: n = 8, EphrinB3-Ab(1 + 2): n = 5, Mann–Whitney U test **P < 0.01]. j Manual quantification of remyelinated and demyelinated axons within lesions confirmed accelerated remyelination in Anti-EphrinB3-treated animals [control-IgG: n = 4, EphrinB3-Ab(1 + 2): n = 4, t test **P < 0.01]. k, l Electron micrographs demonstrating enhanced remyelination in EphrinB3-Ab(1 + 2) infused lesions as compared to IgG controls. Error bars ± SEM. Scale bar in c, d = 30 μm; in g, h = 200 μm (in inset = 50 μm), in k, l = 5 μm
