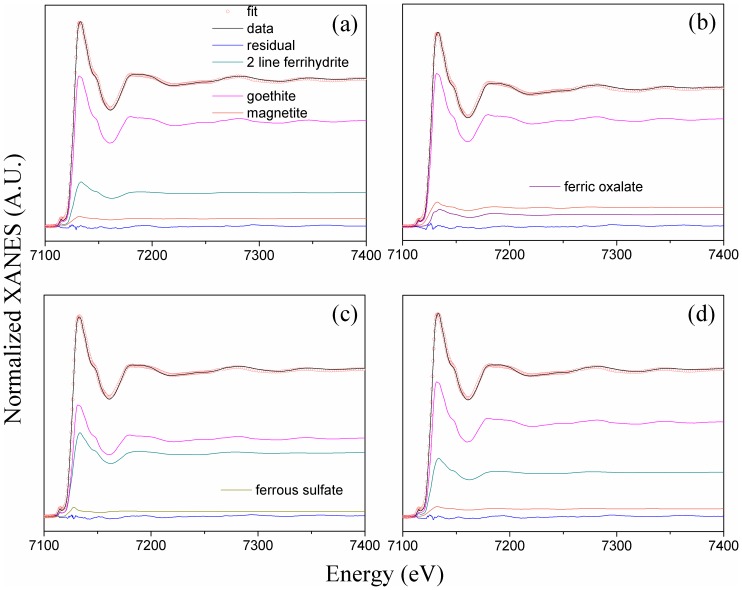
Fig 3. Fe K-edge XANES spectra of soil colloids from contrasting fertilisation treatments.
(a) Control, no fertilisation; (b) NPK, chemical fertilisation; (c) NPKM, chemical plus swine manure fertilisation; (d) M, swine manure fertilisation. The scattered circles represent the linear combination fitting (LCF) results of the sample spectra.

