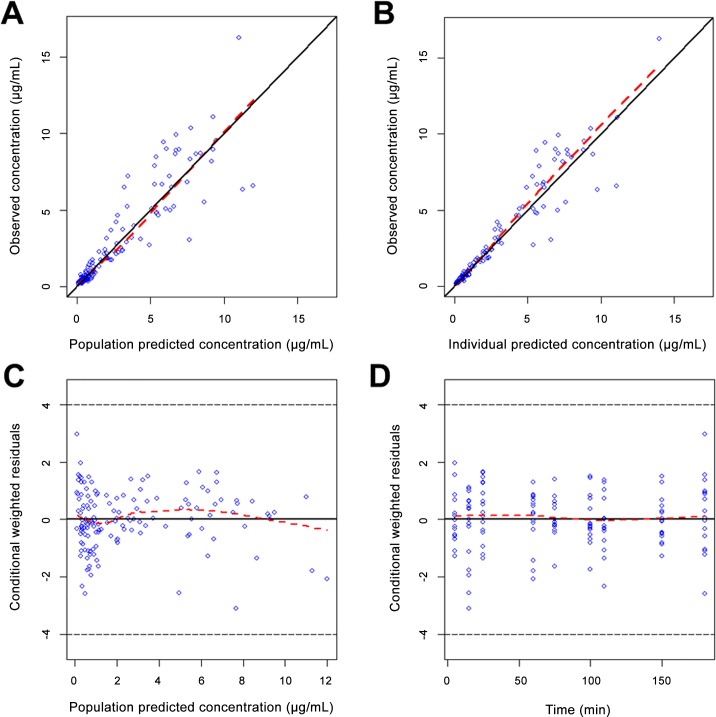
Fig 5. Goodness-of-fit plots for the final PK model.
(A) Population prediction versus observed concentration. (B) Individual prediction versus observed concentration. (C) Conditional weighted residuals (CWRES) versus population prediction. (D) Conditional weighted residuals (CWRES) versus time. Dashed red line, a locally weighted least-squares regression; solid black line, line of identity.

