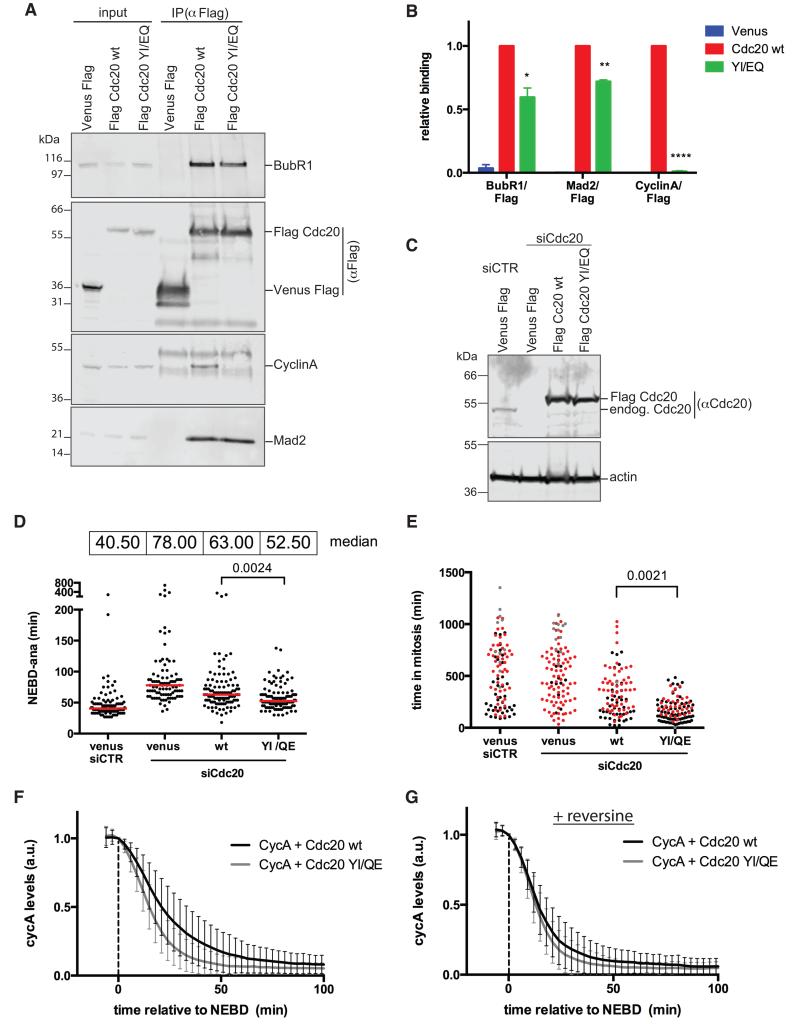
Figure 7. A CDC20 mutant that cannot bind the ABBA motif is unable to bind Cyclin A and is partially refractory to the SAC.
(A) Flag-tagged CDC20 wt and YI/EQ were immunoprecipitated with Flag mAb from taxol-arrested HeLa FRT cell lines and blotted with the indicated antibodies.
(B) Average and SEM of 3 independent experiments shown in (A). Paired t-test used for statistical analysis (*, p<0.05; **, p<0.005; ***, p<0.0005).
(C) HeLa FRT cell lines expressing inducible siRNA-resistant wild-type or YI/EQ mutant CDC20 were transfected with control siRNA or siRNA against CDC20. Immunoblot shows expression levels compared to endogenous CDC20 and the efficiency of knockdown. Actin is a loading control.
(D) Hela FRT cell lines expressing inducible siRNA-resistant Flag-tagged CDC20, were transfected with the indicated siRNA and analysed as in Fig 5B. Red lines indicate the median value. Unpaired t-test used for statistical analysis (n=3).
(E) Rescue experiments as in (D) but in the presence of taxol. Cells that exit mitosis (black), cells that die in mitosis (red), cells arrested in mitosis (grey) are indicated. Unpaired t-test was used for statistical analysis (n=3).
(F) Cyclin A-Venus-Flag degradation in cells transfected with siRNA against CDC20 and microinjected with Venus-Flag- wt Cyclin A together with either wt or YI/EQ mutant CDC20. Average degradation curves with SD were obtained from 48 cells (n=3) for wt CDC20, and 63 cells (n=3) for mutant CDC20. Time is relative to NEBD.
(G) Average curves were obtained as in (F), but in the presence of reversine. 49 cells (n=3) for wt CDC20, and 45 cells (n=3) for mutant CDC20 were analysed.

