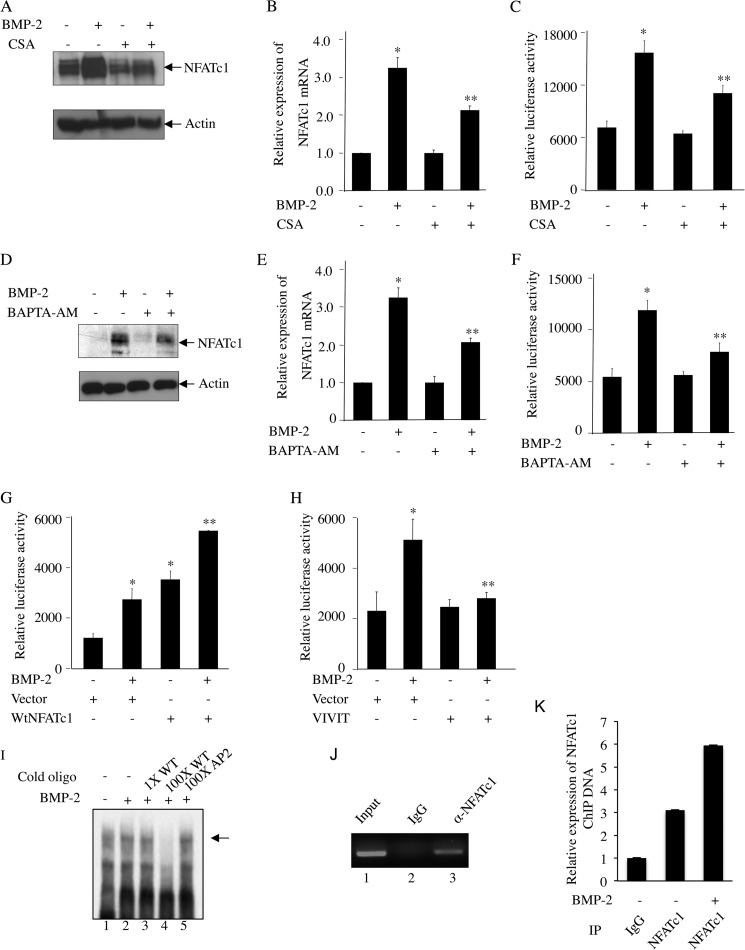
FIGURE 7.
BMP-2-induced autoregulation of NFATc1. A–F, BMP-2-mediated NFATc1 expression requires Ca2+/calcineurin signaling in osteoblasts. C2C12 cells were pretreated with CsA (A–C) or BAPTA-AM (D–F) followed by incubation with BMP-2. NFATc1 protein (A and D) or mRNA (B and E) expression and transcriptional activity (C and F) were analyzed by immunoblotting with NFATc1 and actin antibodies, qRT-PCR analysis, or luciferase activity assay as described in Fig. 2, B, C, and D, respectively. For B, C, E, and F, mean ± S.E. of quadruplicate measurements is shown. *, p < 0.001 versus control; **, p < 0.01 versus BMP-2-treated. G, NFATc1 promoter activity is induced by NFATc1 expression. C2C12 cells were cotransfected with NFATc1-Luc plasmid and NFATc1 expression plasmid followed by incubation with BMP-2. Luciferase activity was measured in the cell lysates as described in Fig. 2D. H, inhibition of NFATc1 activity by VIVIT blocks BMP-2-mediated NFATc1 promoter activity. C2C12 cells were transfected with VIVIT expression plasmid together with NFATc1-Luc followed by BMP-2 treatment. Luciferase activity was determined in the cell lysates as described in Fig. 2D. For G and H, mean ± S.E. of triplicate measurements is shown. *, p < 0.01 versus control; **, p < 0.01 versus BMP-2-treated. I–K, BMP-2 increases interaction of NFATc1 with NFATc1 P1 promoter at −700 bp. Nuclear extracts from C2C12 cells treated with BMP-2 were analyzed by EMSA using radiolabeled NFATc1 probe spanning −700 to −661 bp as described under “Experimental Procedures” (I). Cold oligonucleotide probe for NFATc1 (lanes 3 and 4) or AP2 (lane 5) was used in EMSA. J and K, ChIP assay was used to detect NFATc1 binding as described under “Experimental Procedures.” Error bars represent S.E. IP, immunoprecipitation.

