
FIGURE 1.
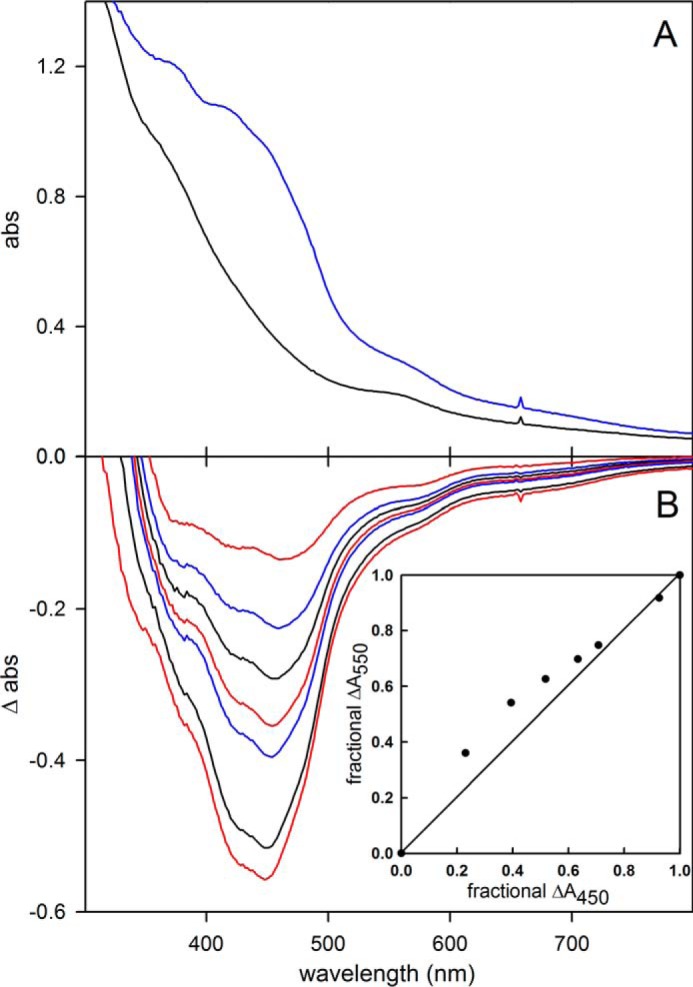
Reductive titration of FdsABG. A, oxidized (blue) and sodium dithionite-reduced (black) spectra. B, change in absorbance as a function of reduction. The inset plots the relative absorbance at 550 nm versus relative absorbance at 450 nm, with the diagonal (reflecting strict proportionality in the absorbance change at the two wavelengths) indicated. Details of titration are described under “Experimental Procedures.”