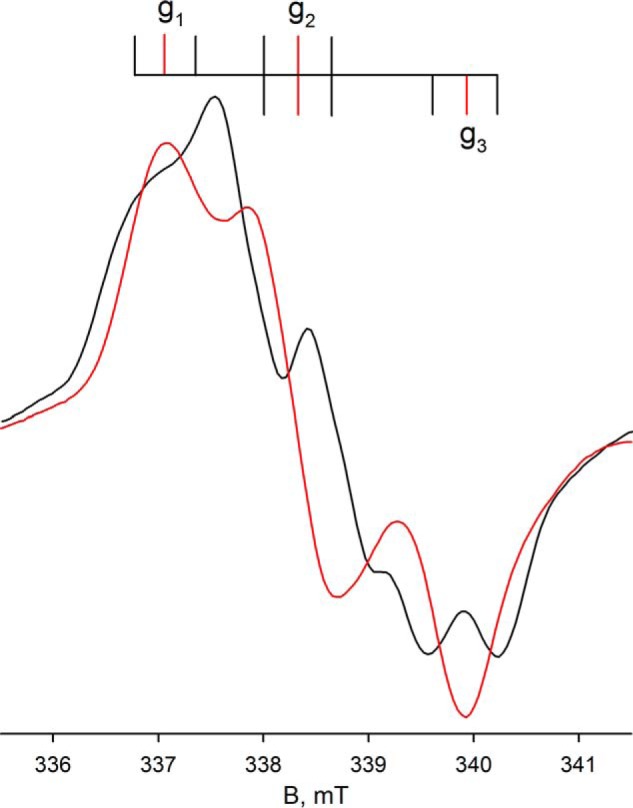
FIGURE 5.

Expanded view of the EPR of molybdenum center of FdsABG from Fig. 4. Superposition of the composite MoV-Fe/S EPR spectra from Fig. 4A (black) with Fig. 4D (red). The line diagram above indicates the location of the principal g tensors (red vertical lines) and the approximate location of the 1H hyperfine splitting (I = 1/2) in the spectrum from Fig. 4A (black vertical lines).
