
FIGURE 9.
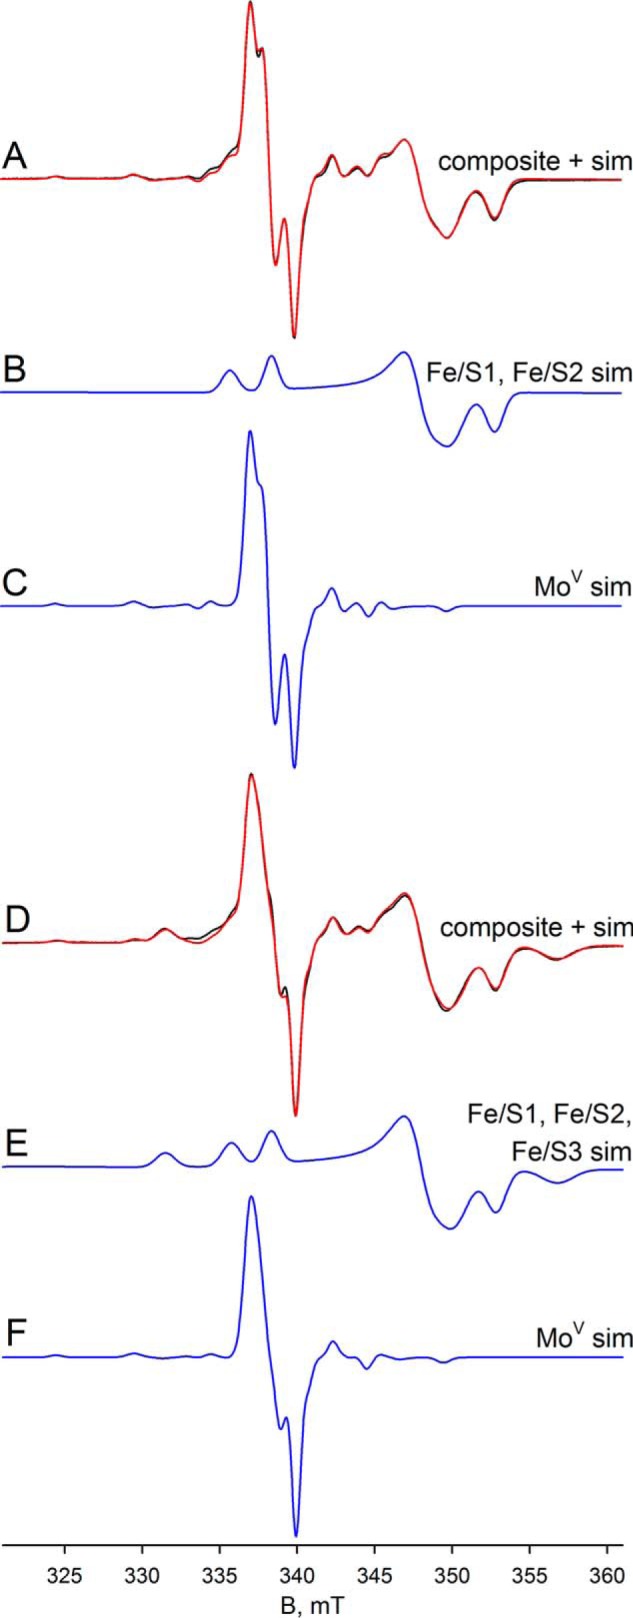
EPR of deuterated molybdenum center of FdsABG collected at 20–60 K. A, MoV-Fe/S EPR spectrum (black) and simulation (red) of FdsABG sample as described in Fig. 4D collected with modulation amplitude = 2 Gauss and microwave power = 0.2 mW at 60 K. The MoV component represents ∼27% of total spin density. B, simulation of the Fe/S1 and Fe/S2 contributions to the spectrum in A. C, simulation of the MoV contribution to the spectrum in A. D, MoV-Fe/S EPR spectrum (black) and simulation (red) of FdsABG sample from A. above collected with modulation amplitude = 2 Gauss and microwave power = 0.02 mW at 20 K. The MoV component represents ∼16% of total spin density. E, simulation of the Fe/S1–Fe/S3 contributions to the spectrum in D. F, simulation of the MoV contribution to the spectrum in D. The simulation parameters are summarized in Table 1. sim, simulation.