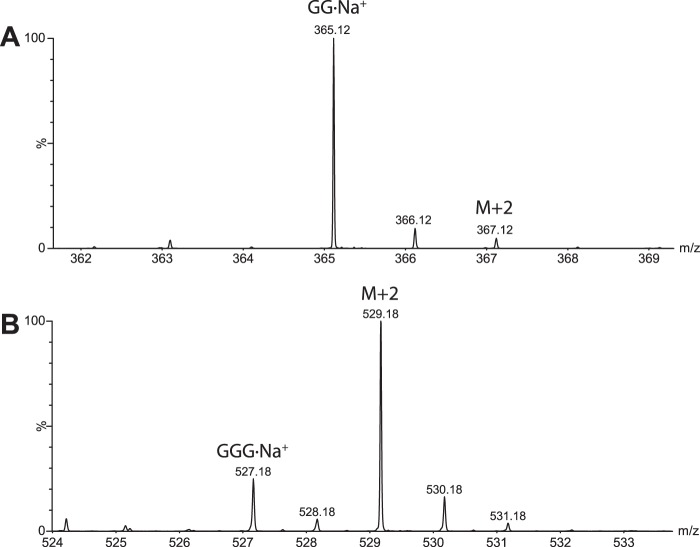
FIGURE 9.
Mass spectrum of the products of cellopentaose degradation by PbGH5A in H218O. A, isotopic distribution of produced cellobiose. No increase in the M + 2 peak indicates no 18O incorporation. B, isotopic distribution of produced cellotriose showing significant increase in the M + 2 peak intensity.

