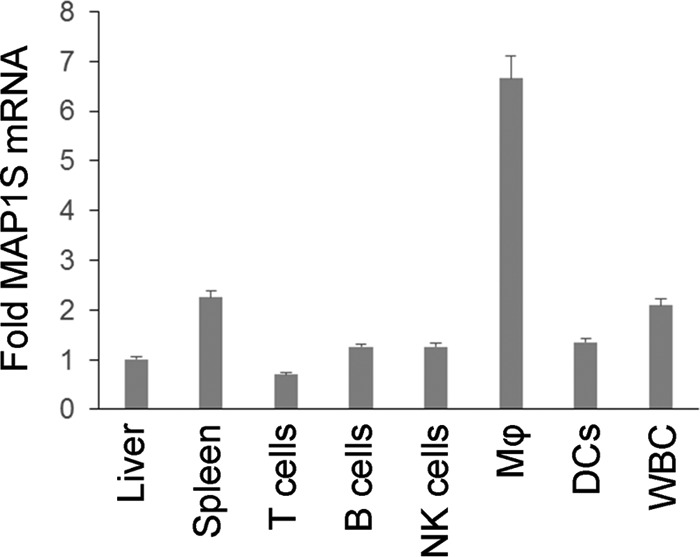
FIGURE 1.

Characterization of the MAP1S expression profile. Real-time RT-PCR was performed to analyze the MAP1S mRNA expression in various cell types in the spleen, including B and CD4+ T lymphocytes, natural killer (NK) cells, dendritic cells (DCs), and macrophages (Mφ), as well as white blood cells (WBC). -Fold expression is shown by comparison with the expression level in the liver. Single-cell suspensions of splenocytes were sorted by FACS. β-Actin was used as a control. Data are shown as mean ± S.D. (n = 3 technical replicates).
