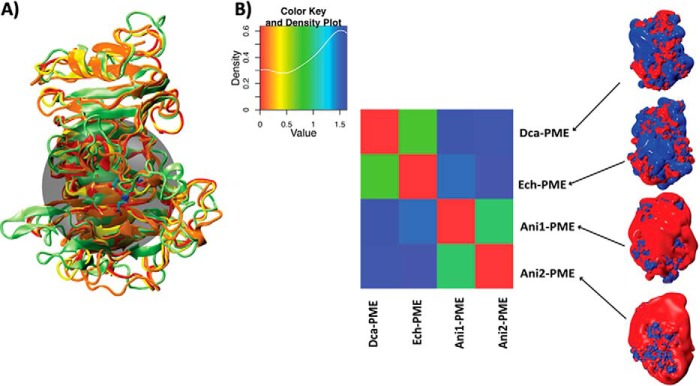
FIGURE 13.
Comparison of the electrostatic potentials for processive and non-processive PMEs. A, structural alignment of the PMEs from D. carota (Dca-PME, orange, PDB code 1gq8), E. chrysanthemi (Ech-PME, light green, PDB code 2nt6 and 2nt9), A. niger isoform 1 (Ani-PME1, red, homology-modeled structure), and A. niger isoform 2 (Ani-PME2, yellow). The transparent black sphere, centered on atom OD2 atom of Ech-PME Asp-199 and having a radius of 15 Å, shows the region chosen for the quantitative comparison of the electrostatic potentials. B, diagonalized matrix colored according to similarity indices calculated for the comparison of the electrostatic potentials of the PMEs shown in A. The color plot and the co-respective values of the similarity index are reported in the inset above. In the right-hand panel, the electrostatic potential densities of the four analyzed PMEs are shown and colored between −1 (red) and +1 kBT/e.

