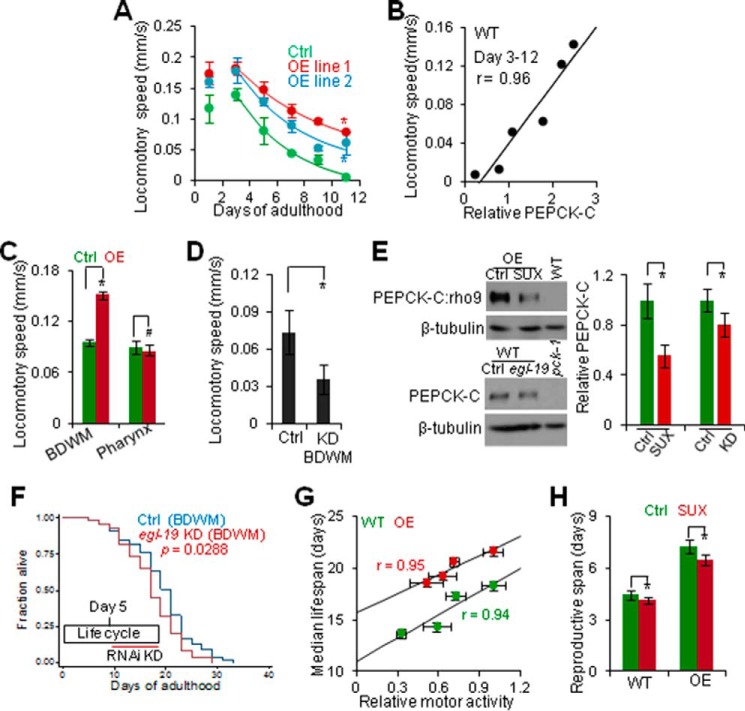
FIGURE 4.
Decline in PEPCK-C with age is coupled with loss of muscle activity to impact aging. A, locomotory speed of control and PEPCK-C OE (n = 5–12). *, p < 0.05; two-way analysis of variance. Fitting lines, first order regression. B, correlation of locomotory speed and PEPCK-C abundance in WT. r, Pearson correlation coefficient. C and D, locomotory speed of day 1 PEPCK-C OE in BDWM or pharynx (C) or NR350 grown on vector control or egl-19 RNAi bacteria (D) (n = 9–12). #, p > 0.05. *, p < 0.05; t test. E, immunoblotting against PEPCK-C. Upper left, SUX (200 nm) exposure to WT expressing rho9-tagged PEPCK-C in BDWM was initiated at day 1 and immunoblotting was done at day 3. Lower left, day 3 NR350 grown on control and egl-19 RNAi bacteria. Right, quantification. n = 3. *, p < 0.05; t test. F, survival of NR350 grown on vector control or egl-19 RNAi bacteria. G, correlation of median lifespan and locomotory speed (n = 3 (lifespan) or 10 (motor activity)). r, regression coefficient. H, effect of SUX (200 nm) exposure on reproductive life (n = 200). *, p < 0.05, t test.

