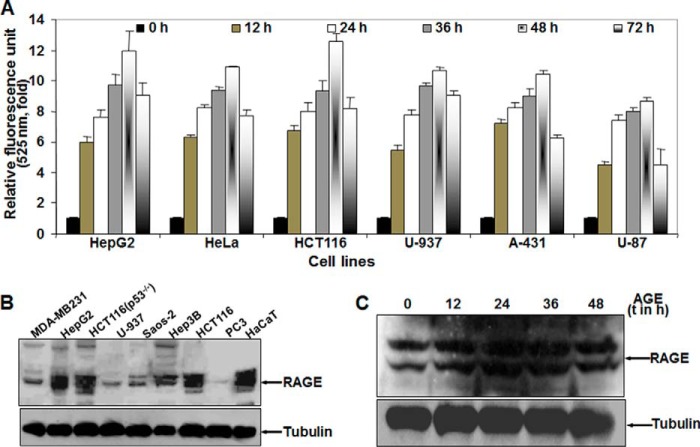
FIGURE 2.
The effect of AGE on induction of autophagy in various cell types. A, different cells were incubated without or with AGE (100 μg/ml) for different times. The fluorescence photometry experiment was performed in triplicate, and data extrapolated from three independent experiments are represented as -fold of induction (mean ± S.E.), taking the unstimulated cell value as 1-fold. B, the basal amount of RAGE was measured from WCEs of various cell lines (100 μg of protein) by Western blot analysis. C, the amount of RAGE was determined from WCE in AGE-stimulated cells for different times (t) by Western blot analysis.

