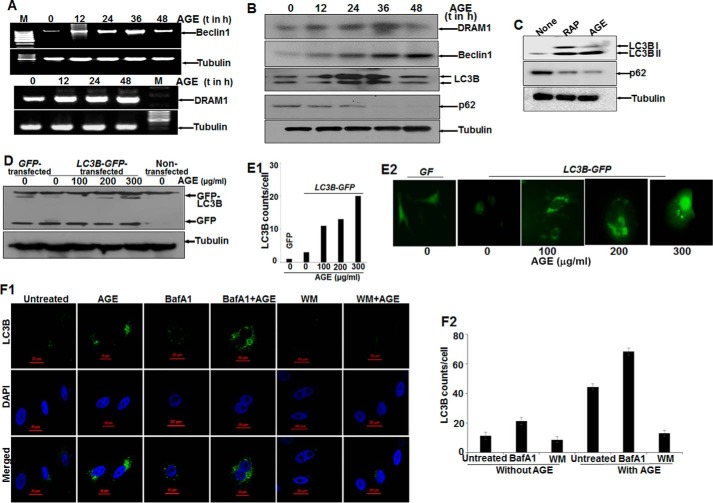
FIGURE 3.
The effect of AGE on autophagy in HepG2 cells. A, semiquantitative PCR analysis of autophagy genes in AGE-stimulated cells for various time (t) periods. M, marker lane. B, WCEs were prepared from AGE-stimulated cells for different times, and Western blot analysis was performed to detect DRAM1, Beclin1, LC3B, and p62. C, the amounts of LC3B and p62 were determined by Western blot analysis in rapamycin (RAP) and AGE-stimulated cells. D, HepG2 cells were transfected with GFP-LC3B and stimulated with AGE. Western blot analysis was performed from WCEs prepared from these cells, stimulated with different concentrations of AGE for 24 h. E1 and E2, representative fluorescence images from GFP-LC3B transfected cells stimulated without or with different concentrations of AGE for 24 h (E2), and the LC3B puncta counts are plotted as well (E1). F1, immunofluorescence images were captured using ant-LC3B antibody for bafilomycin A1 (BafA1) or WM treatment in the presence or absence of AGE. F2, LC3B dots were counted and plotted.

