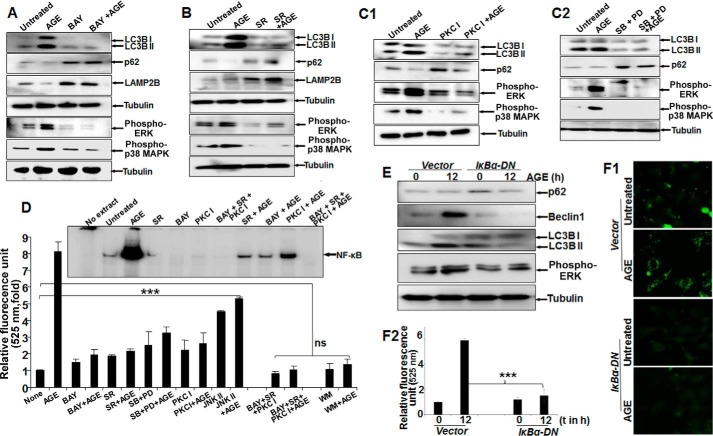
FIGURE 4.
The effect of various inhibitors on AGE-mediated autophagy. A, Western blot analysis was performed from WCEs prepared from cells pretreated with the IKKβ/α inhibitor BAY11-7082 (2 μm) for 3 h, followed by AGE (100 μg/ml) stimulation for 12 h. The amounts of LC3B, LAMP2B, p62, phospho-ERK1/2, and phospho-p38 MAPK were determined by Western blot analysis. B, the amounts of phospho-ERK1/2 and phospho-p38 MAPK along with LAMP2B, p-62, and LC3B were determined by Western blot analysis in SR-pretreated cells (10 μm for 3 h) followed by AGE-stimulated (100 μg/ml for 12 h) cells. C1, cells were pretreated with PKC inhibitor (PKC I) (2 μm for 3 h), followed by stimulated with AGE for 12 h. The WCE was used to perform the Western analysis blot to determine the amounts of phospho-ERK1/2, phospho-p38 MAPK, p62, and LC3B. C2, WCE from cells stimulated with AGE for 12 h and pretreated with PD98059 (PD, 2.5 μm for 5 h) or SB202190 (2.5 μm for 5 h) were collected, and we determined the amounts of LC3B, p62, and phopho-ERK1/2 or phospho-p38 MAPK by Western blot analysis. D, HepG2 cells were pretreated with BAY, SR, or PKC I and all together for 3 h, followed by stimulation with AGE for 12 h. Data from one fluorescence photometry experiment of three independent experiments are represented as -fold increase, considering the unstimulated/untreated cell value as 1-fold. Error bars represent mean ± S.E., Student's t test. Inset, NF-κB DNA binding assayed from NE. E, cells transfected with IκBα-DN for 6 h were incubated for 12 h. Cells were stimulated with AGE for 12 h, and the amounts of Bectlin1, LC3B, p62, and phospho-ERK were determined by Western blot analysis. F1 and F2, transfected cells stimulated with AGE were stained with MDC, and fluorescence images are shown (F1) along with quantification (F2). t, time. Error bars represent mean ± S.D. ns, not significant; ***, p < 0.001.

