FIGURE 5.

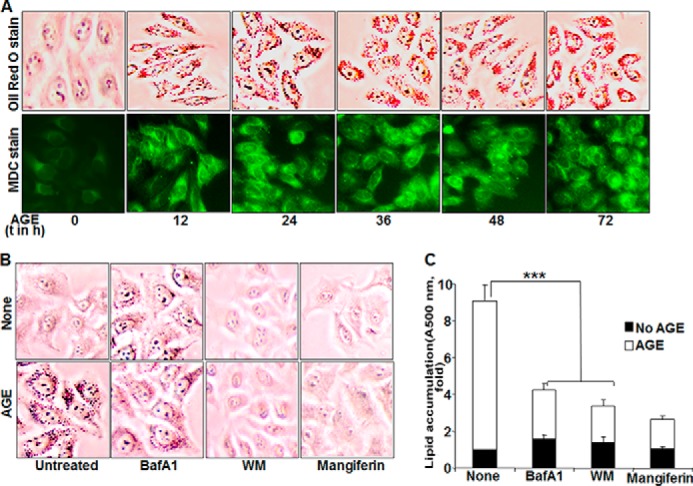
The effect of AGE on autophagy and lipogenesis. A, bottom row, HepG2 cells were stimulated with 100 mg/ml AGE for different times (t). Cells were stained with MDC, followed by visualization under a fluorescence microscope. Top row, stimulated cells were incubated with Oil Red O stain and visualized under a microscope. B, HepG2 cells were pretreated with mangiferin (10 μg/ml) and WM (100 nm) for 3 h or bafilomycin A1 (BafA1, 10 nm) for 5 h, followed by stimulation with AGE (100 μg/ml) for 12 h. Images of Oil Red O-stained cells are shown. C, quantification of Oil Red O-stained particles in HepG2 cells was done by measuring absorption at 500 nm and is represented as -fold, considering the unstimulated cell value as 1-fold. Error bars represent mean ± S.E. (Student's t test). ***, p < 0.001.
