FIGURE 6.
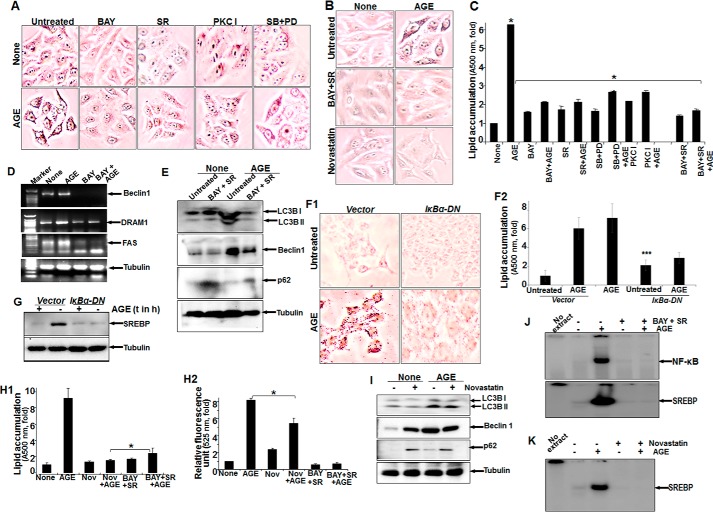
The effect of various inhibitors on AGE-induced autophagy and lipogenesis. A, HepG2 cells were pretreated with BAY, SR, PKC I, SB, and PD98059 (PD) for 3 h, followed by stimulation with AGE for 12 h. Images of Oil Red O-stained cells were captured under a light microscope and are shown. B, cells were pretreated with BAY and SR or novastatin for 3 h and then stimulated with AGE for 12 h. The images were captured after Oil Red O staining. C, HepG2 cells were pretreated with BAY, SR, PKC I, SB, and PD98059 or BAY and SR for 3 h, followed by AGE stimulation of 12 h. Absorption of Oil Red O-stained particles was recorded at 500 nm and is represented as -fold. D, HepG2 cells were pretreated with BAY for 3 h, followed by stimulation with AGE for 12 h. The amounts of Beclin1, DRAM1, and fatty acyl synthase (FAS) were determined by semiquantitative PCR from total RNA extracted from these cells. E, cells were treated with BAY and SR for 3 h and then stimulated with AGE for 12 h. The amounts of LC3B, Beclin1, and p62 were determined from WCEs. F1 and F2, HepG2 cells transfected with IκBα-DN constructs were stimulated with AGE (100 μg/ml) for 24 h and stained with Oil Red O (F1), and absorbance is indicated as -fold (F2). G, the stimulatory effect of AGE on SREBP expression was assessed by Western blot analysis in IκBα-DN transfected cells. t, time. H1 and H2, cells were treated with novastatin (Nov) or BAY and SR for 3 h and then stimulated with AGE for 12 h. Quantification of lipid droplets was determined in Oil Red O-stained cells (H1) or autophagy and MDC-stained cells. H2, the data indicate –fold, considering the unstimulated cell value as 1-fold. I, the amounts of LC3B, Beclin1, and p62 were determined by Western blot analysis from WCEs of novastatin-treated cells followed by AGE-stimulated cells. J, NF-κB and SREBP DNA binding was determined from NE by gel shift assay collected from BAY- and SR-treated cells followed by AGE-stimulated cells. K, SREBP DNA binding was determined from NE by gel shift assay collected from novastatin-treated cells followed by AGE-stimulated cells. Error bars represent mean ± S.E. (Student's t test). *, p < 0.05; ***, p < 0.001.

