FIGURE 7.

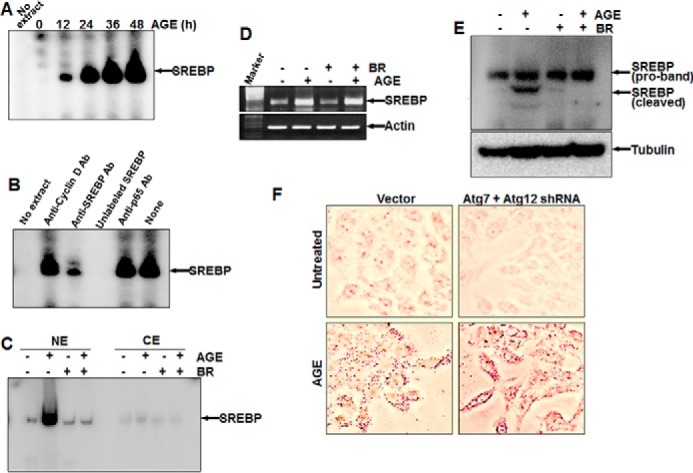
The effect of AGE on SREBP expression and the role of autophagy in lipid accumulation. A, HepG2 cells were stimulated with AGE (100 μg/ml) for different times, and SREBP DNA binding was assayed. B, the Nes of AGE-induced cells were incubated with 2 μg of anti-cyclin D1, anti-SREBP, or anti-p65 antibody or unlabeled SREBP DNA (200 ng, double-stranded) for 1 h at 4 °C, and SREBP DNA binding was assayed. C, cells were treated with BR for 3 h and then stimulated with AGE for 12 h. SREBP DNA binding was determined from NE from 50% cells. CE, cytoplasmic extract. D, the remaining 50% cells were used for semiquantitative PCR to determine the amounts of SREBP mRNA and actin. E, the amount of SREBP was determined from BR-pretreated and AGE-stimulated cells by Western blot analysis. F, HepG2 cells, transfected with Atg7 and Atg12 shRNA were stimulated with AGE for 12 h. Cells were stained with Oil Red O and visualized under a microscope.
