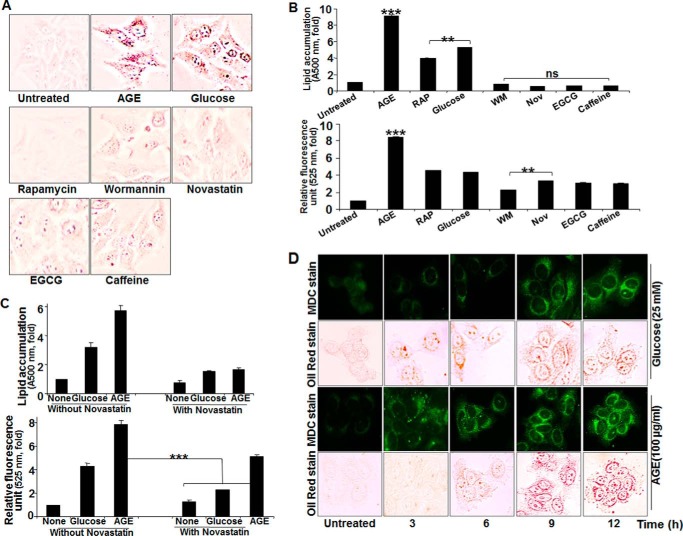
FIGURE 8.
The effect of various inhibitors on AGE-induced autophagy and lipogenesis. A, HepG2 cells were stimulated with AGE, rapamycin (100 nm), glucose (25 mm), WM (100 nm), novastatin (2 μg/ml), epigallocatechin gallate (EGCG, 10 μm), and caffeine (0.5 μm) for 12 h, followed by Oil Red O staining. B, HepG2 cells, treated with AGE, rapamycin (RAP), glucose, WM, novastatin (Nov), epigallocatechin gallate, and caffeine for 12 h were used for Oil Red O staining and fluorescence photometry. The representative graphs are from single independent experiment showing mean ± S.D. of triplicate samples. C, HepG2 cells were stimulated with AGE and glucose in the presence or absence of Nov for 12 h, and lipid accumulation as well as autophagy index were determined and represented as mean ± S.E. from triplicate samples of two independent experiments. D, HepG2 cells were treated with AGE and glucose for 0, 3, 6, 9, and 12 h. These cells were subjected to double staining. First, cells were stained with MDC, followed by Oil Red O. The represented images were captured in the same view field. Error bars represent mean ± S.E. (Student's t test). ns, not significant; **, p < 0.01; ***, p < 0.001.

