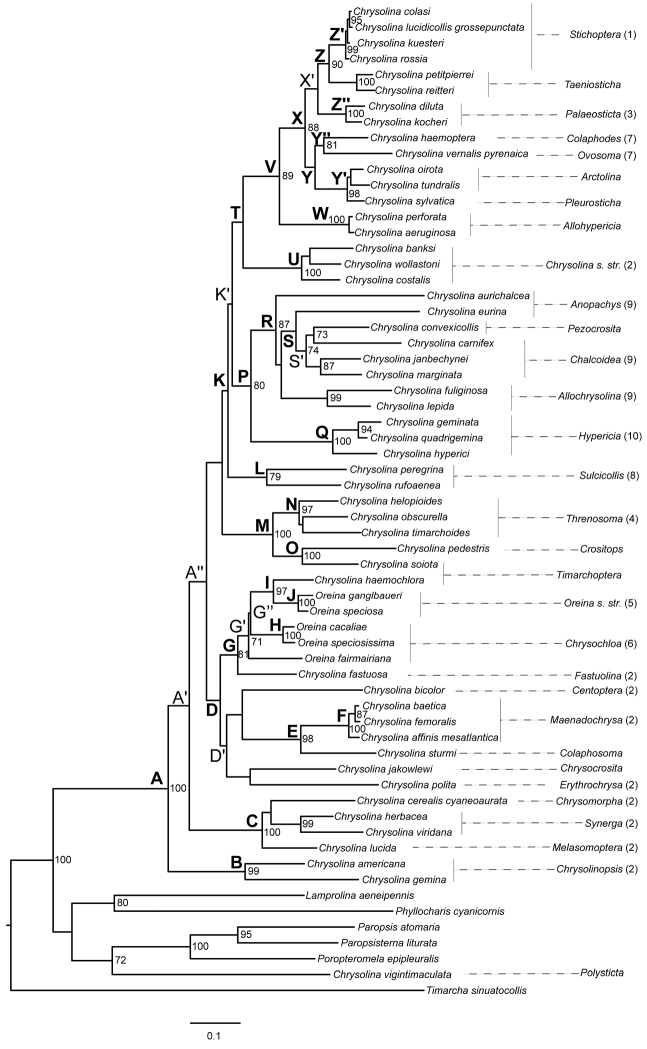
Figure 2.
Maximum likelihood phylogenetic tree obtained from the combined analysis of cox1, rrnL and H3. Node numbers represent bootstrap support values. Only support values higher than 0.7 are shown. Numbers accompanying the subgeneric classification of the Chrysolina species on the right correspond to the systematic groups defined by Bourdonné and Doguet (1991). Clades mentioned in the text are highlighted.

