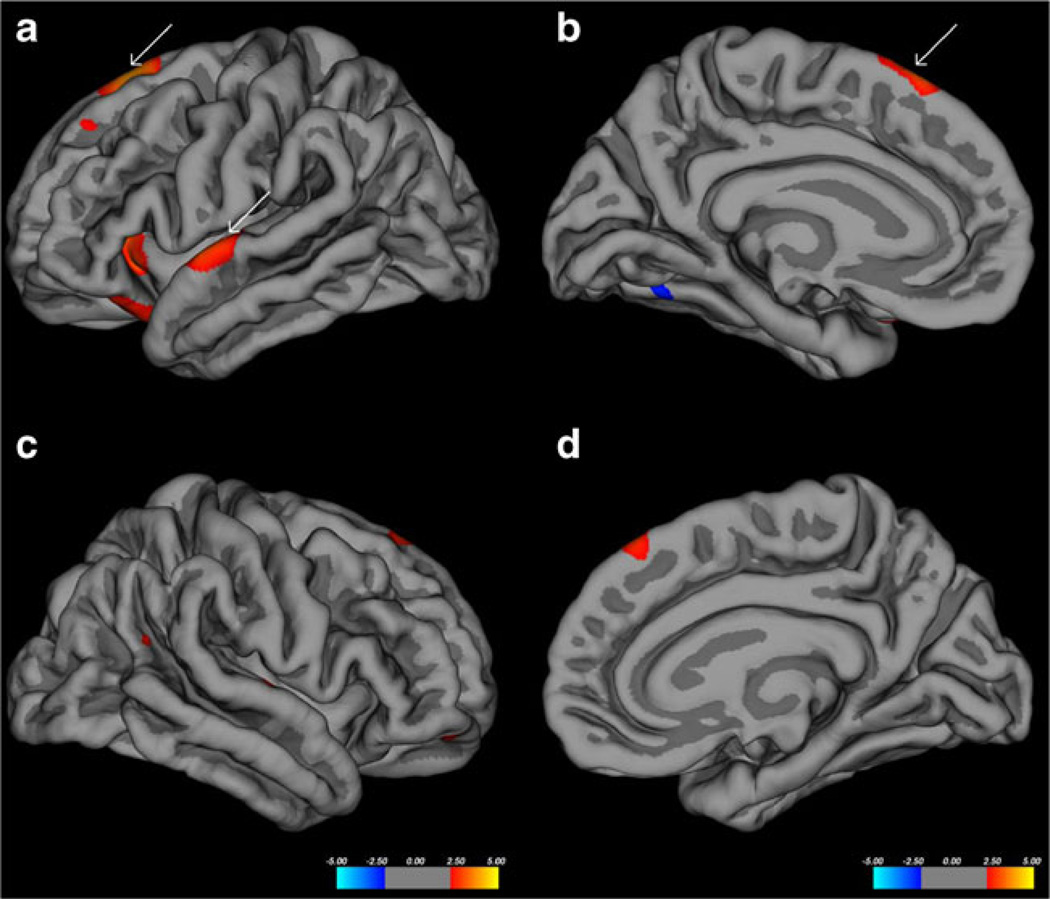
Fig. 1.
Pial surface maps showing areas (clusters) of significant thinning (red) between the two groups before multiple comparison correction. a and b show right lateral and medial surfaces respecitively. c and d show right lateral and medial surfaces respectively. White arrows show two clusters that remain significant after FDR correction

