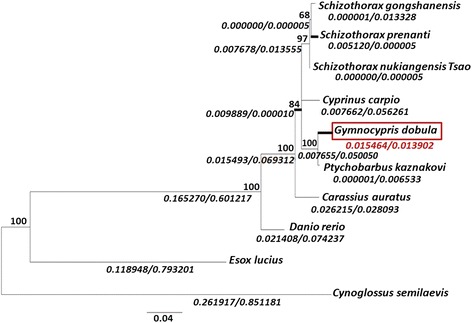
Fig. 3.

Evolutionary relationships of the EPOs. The phylogenetic tree was constructed using the ML method, as described in the Methods. The calculated d N/d S (ω) values (in italics) and bootstrap values are shown in each branch. The branches with ω values ≥ 1.0 are shown in bold. The Tibetan Plateau schizothoracine G. dobula assigned to the foreground is highlighted by a red solid rectangle
