
Fig. 5.
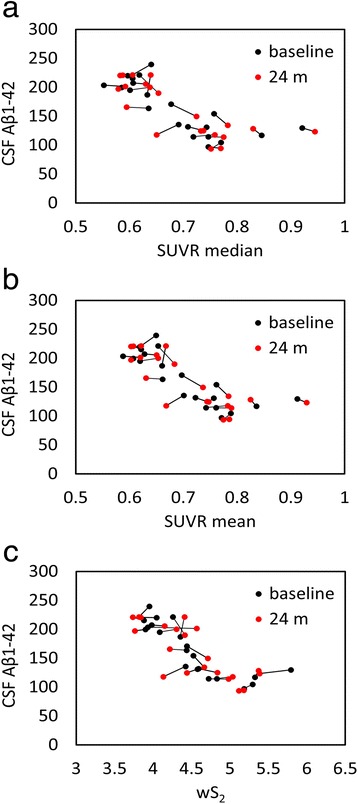
Scatterplots of all cerebrospinal fluid (CSF) amyloid-β1–42 (Aβ1–42) versus standardized uptake value ratio (SUVR) median (a), mean (b), and weighted two-point correlation function (wS2) (c) values obtained by normalization of positron emission tomography activity to white matter (10 %) at baseline (black dots) and 24-month follow-up (red dots)