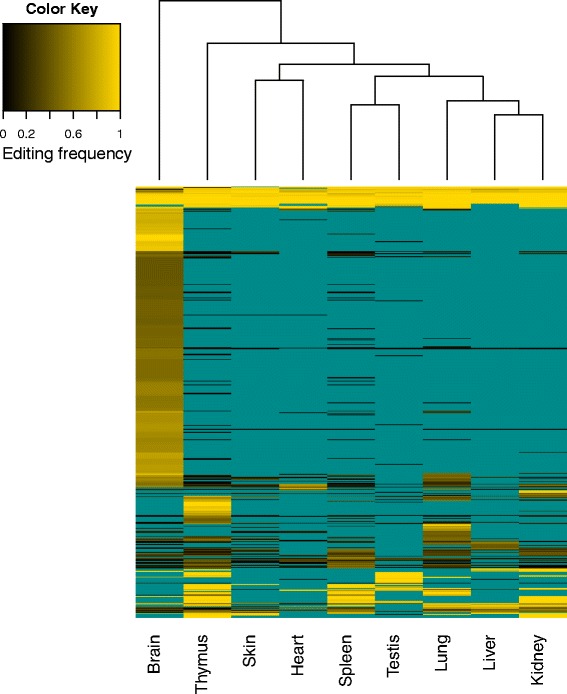
Fig. 5.

A-to-I editing frequency at 575 sites across nine tissues, represented as a heatmap. These sites were selected on the basis of having at least 10X coverage and an editing frequency > 0.4 in at least one tissue. Tissues for which the coverage was < 10X at a site appear as cyan, and these correspond to sites that would have been removed during the variant filtering process for calling RDDs. Very few sites are highly edited across all nine tissues. Most sites that are edited in only one tissue are often not expressed (insufficient read coverage) in the other tissues
