Fig. 7.

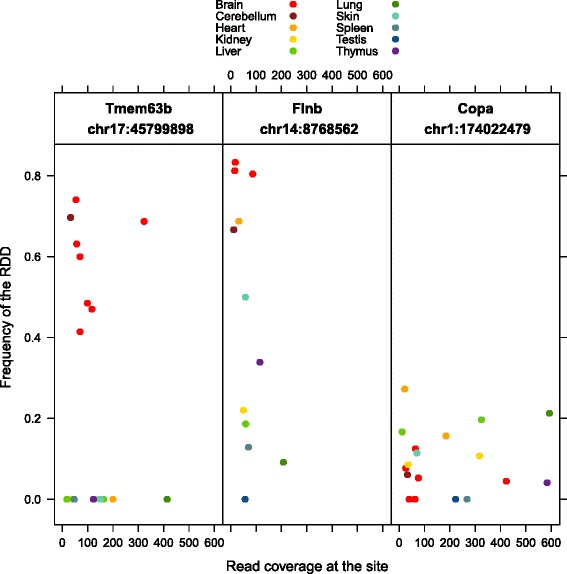
The variability in editing frequency per site across tissues. Three sites where the RDD encodes a non-synonymous change were selected and presented here (Tmem63b, Flnb, and Copa). Only samples with ≥ 10X coverage at these sites are plotted

The variability in editing frequency per site across tissues. Three sites where the RDD encodes a non-synonymous change were selected and presented here (Tmem63b, Flnb, and Copa). Only samples with ≥ 10X coverage at these sites are plotted