
Fig. 1.
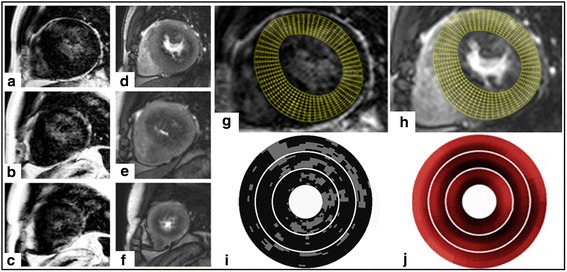
Example of combined high-resolution fibrosis and perfusion mapping. a-c late gadolinium enhancement (LGE) images. d-f stress perfusion images. Top, middle and bottom rows correspond with basal, mid and apical slices respectively. Images (g) and (h) indicate high-resolution maps for LGE and stress perfusion respectively (basal slice only), with the grid used for high-resolution maps of LGE (I) and stress perfusion (J) shown below