
Fig. 2.
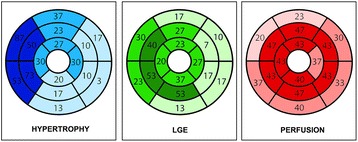
Schematic representation of the distribution of hypertrophic segments, late gadolinium enhancement (LGE) and perfusion abnormalities based on visual assessment, expressed as percentages of the total cohort
Official websites use .gov
A
.gov website belongs to an official
government organization in the United States.
Secure .gov websites use HTTPS
A lock (
) or https:// means you've safely
connected to the .gov website. Share sensitive
information only on official, secure websites.
Schematic representation of the distribution of hypertrophic segments, late gadolinium enhancement (LGE) and perfusion abnormalities based on visual assessment, expressed as percentages of the total cohort