
Fig. 3.
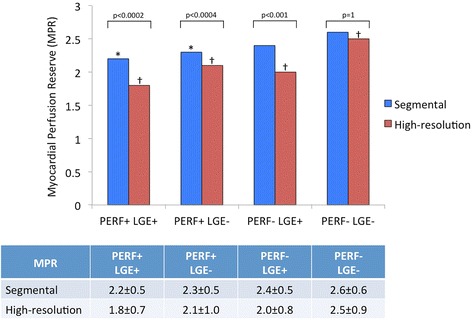
Comparison between myocardial perfusion reserve (MPR) values obtained by using segmental and high-resolution quantification. Regions are classified according to the results of perfusion (PERF) and late gadolinium enhancement (LGE) visual assessment. *p < 0.0001 vs. segmental MPR of PERF-LGE- regions; † p < 0.0001 vs. all other groups for high-resolution MPR