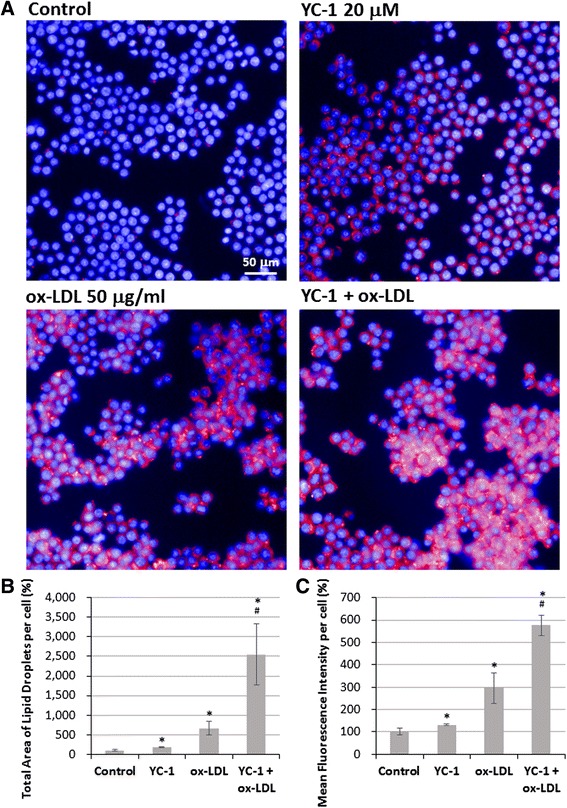
Fig. 4.

YC-1 induces lipid droplet formation in ox-LDL-mediated foam cells. RAW 264.7 macrophages were treated with 20 μM YC-1, 50 μg/mL ox-LDL, or both YC-1 and ox-LDL for 24 h. After fluorescence staining with AdipoRed™ (red for intracellular lipid) and Hoechst 33342 (blue for nucleus), the total area of lipid droplets and mean fluorescence intensity labelled by AdipoRed were detected and analyzed in each cell using an HCS reader. Scale bar = 50 μm. a The imaging of HCS. b Quantification of total area of lipid droplet per cell (n = 5). c Quantification of mean fluorescence intensity per cell (n = 5). * indicates P < 0.05 compared to the control group; # indicates P < 0.05 compared to the ox-LDL-treated group
