
Fig. 4.
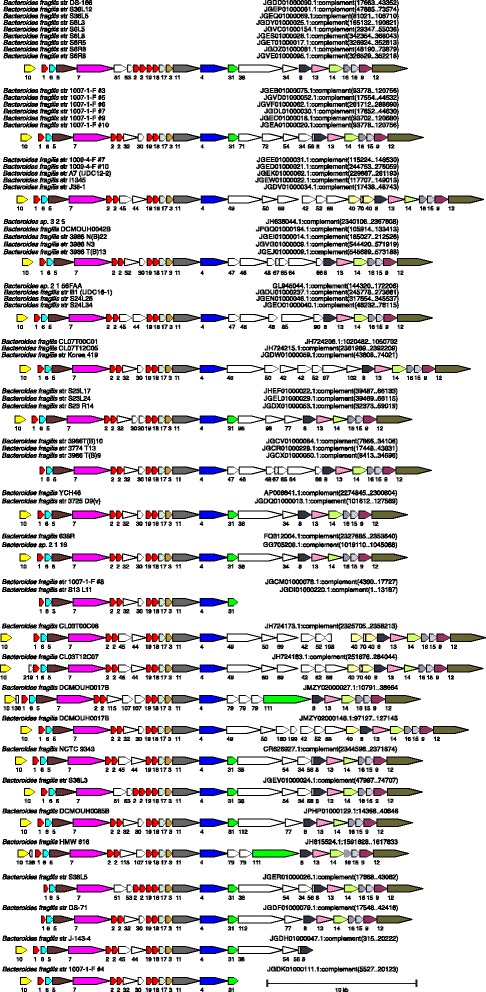
ORF maps of the human gut Bacteroidales GA3 T6SS loci. Alignment of GA2 T6SS loci demonstrating the conservation of these regions. Maps labeled with multiple isolate names indicate these DNA sequences matched each other at 99 % identity over 96 % of their lengths; an ORF map representative of each set is shown. This architecture was found in B. fragilis only. Most of the genomes are draft assemblies, and many of the segments shown comprise entire contigs -- maps that appear truncated upstream or downstream likely reflect difficulties during assembly. The number of the cluster into which the encoded protein segregated is shown under each gene. The ORF maps are colored according to the key provided in Fig. 1