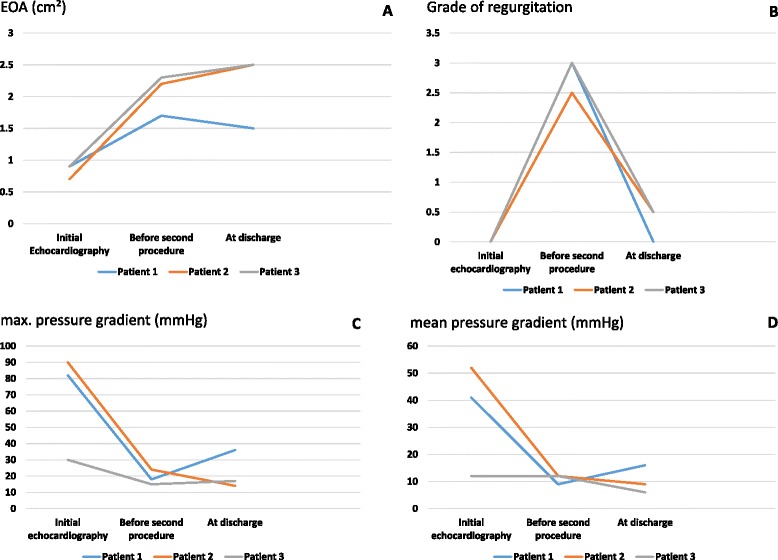
Fig. 1.

EOA, PVL and max/mean pressure gradients. Graphical overview of development of EOA (a), grade of regurgitation (b) and max/mean pressure gradients (c; d) from initial echocardiography before index procedure to discharge after valve-in-valve procedure with the Edwards Sapien 3®. (EOA- effective orifice area; TAVI- transcatheter aortic valve implantation)
