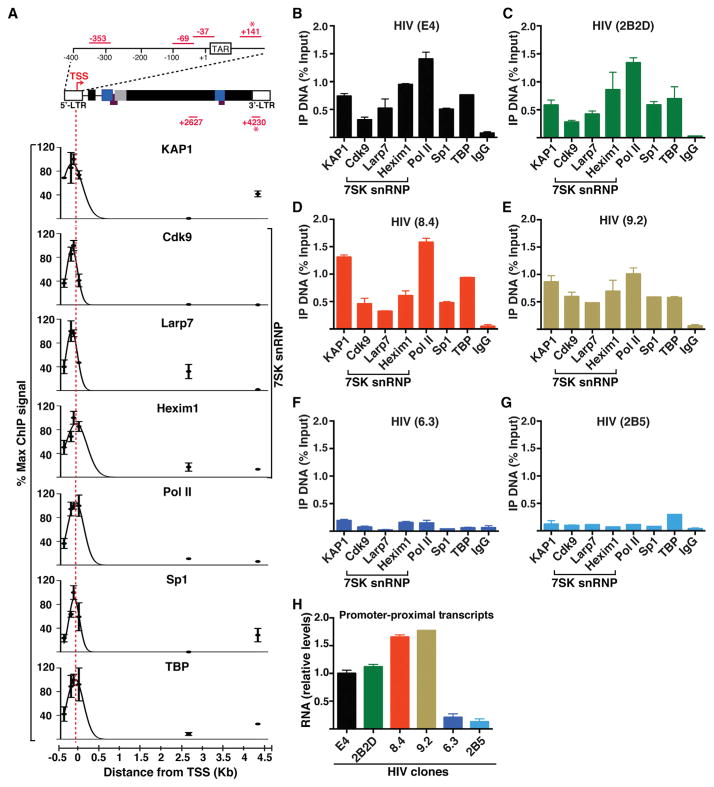
Figure 2. KAP1 and the 7SK snRNP Complex Co-occupy the HIV Promoter-Proximal Region along with Paused Pol II.
(A) ChIP assays on the Jurkat HIV E4 clone followed by qPCR using primer pairs amplifying six different genomic regions (dots). Maximal ChIP signal was arbitrarily set to 100%, and all other amplifications were standardized to it (mean ± SEM; n = 3). Amplicons marked with an asterisk indicate 5′-LTR or 3′-LTR specific. From each dataset, best-fit nonlinear regression curves were generated using Prism (GraphPad) to approximate the ChIP signal throughout the HIV genome at a given location. TAR, transactivation response element.
(B) ChIP assays with the indicated antibodies including a normal serum (IgG) in the HIV E4 clone followed by qPCR assays using the 5′-LTR-specific amplicon. Percentage of immunoprecipitated DNA respective to input was calculated (mean ± SEM; n = 3).
(C) Same as in (B) for 2B2D.
(D) Same as in (B) for 8.4.
(E) Same as in (B) for 9.2.
(F) Same as in (B) for 6.3.
(G) Same as in (B) for 2B5.
(H) Quantitation of HIV promoter-proximal transcript levels (+141) normalized to ACTB by qRT-PCR (mean ± SEM; n = 3).

