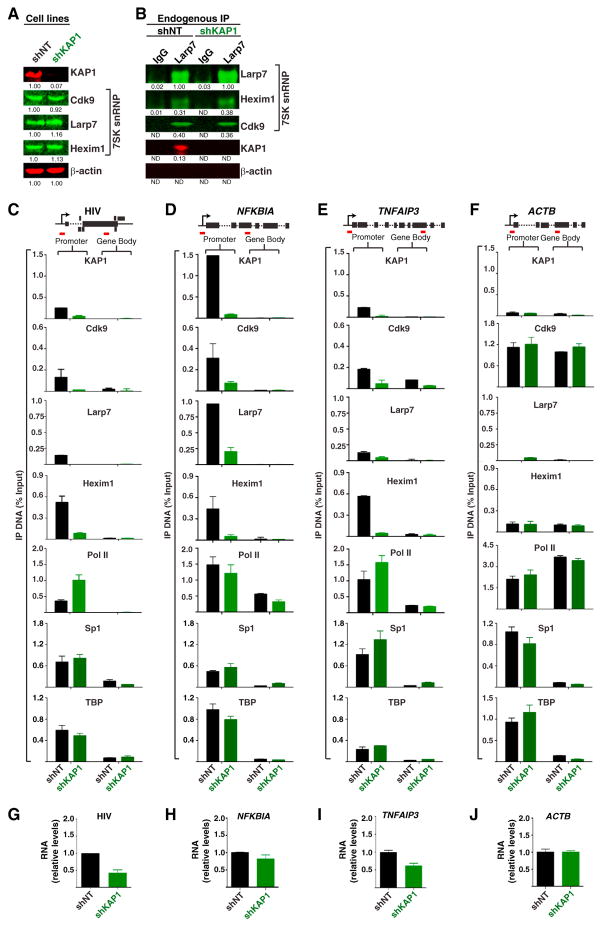
Figure 3. KAP1 Mediates Recruitment of the 7SK snRNP Complex to Promoter-Proximal Regions.
(A) Western blots of the E4 shNT and shKAP1 cell lines. Values represent relative protein levels normalized to β-actin.
(B) Lysates from (A) were immunoprecipitated to monitor levels of 7SK snRNP components. Values represent the amount of immunoprecipitated proteins relative to input. ND denotes below detection limit.
(C) ChIP assay at the HIV locus in the cell lines from (A). Values represent the average of three independent biological replicates minus a nonspecific IgG control (mean ± SEM; n = 3). Short red lines denote the relative locations of promoter and gene body amplicons.
(D) Same as in (C) for NFKBIA.
(E) Same as in (C) for TNFAIP3.
(F) Same as in (C) for ACTB.
(G) Relative HIV transcripts (+2,627) quantified by qRT-PCR and normalized to ACTB (mean ± SEM; n = 3).
(H) Same as in (G) for NFKBIA.
(I) Same as in (G) for TNFAIP3.
(J) ACTB transcript levels were standardized to 1 for each cell line.
See also Figure S2.

