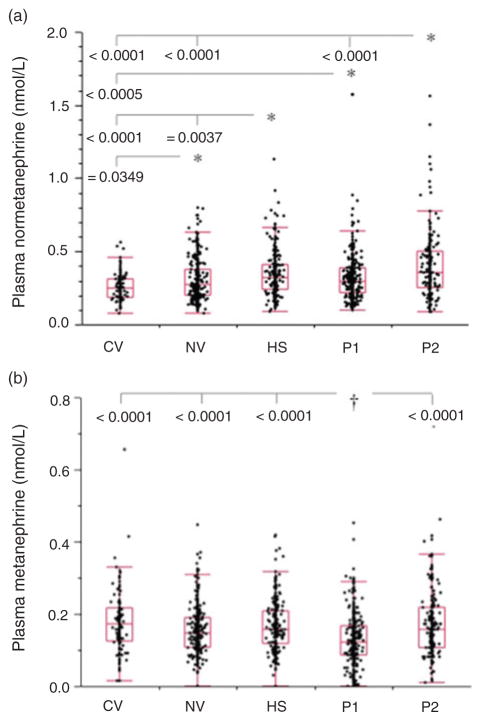
Figure 2.
Box plots showing distributions of plasma concentrations of normetanephrine (a) and metanephrine (b) among the five subgroups of the reference population. CV, child volunteers; NV, normotensive heathy volunteers; HS, hypertensive subjects; P1, patient group 1 (tested for phaeochromocytoma because of an incidental mass found on imaging, an underlying germline mutation or a previous history of the tumour); P2, patient group 2 (tested for phaeochromocytoma because of signs and symptoms of catecholamine excess). *†Indicates groups with higher* and lower† concentrations than other connected groups at the indicated levels of significance

