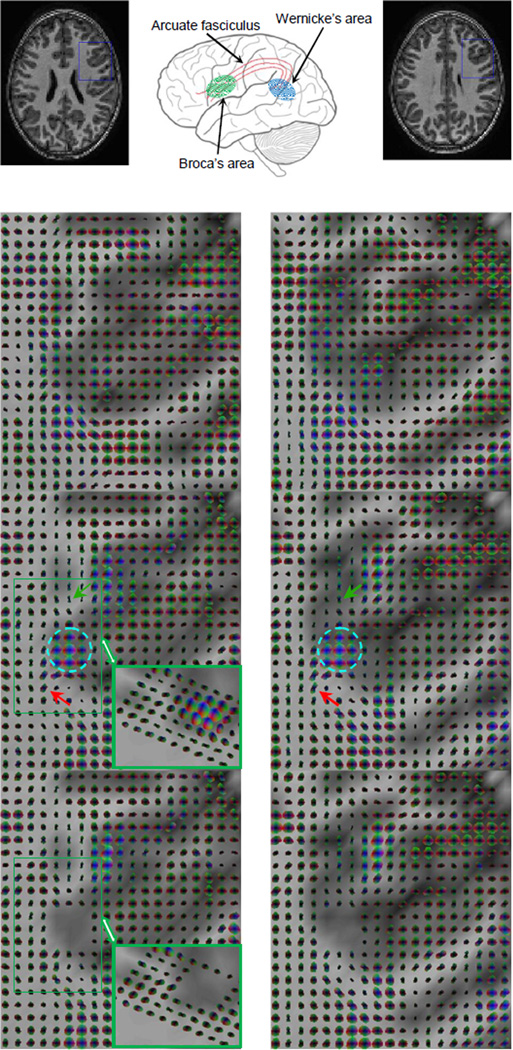
Figure 3. Spatio-temporal functional correlation tensors at rest and during performance of language tasks.
From top to bottom rows are T1-weighted images and illustrations of the language circuit, resting state FCTs in the boxed region of the top row, FCTs under task conditions and with partial correlations. Left and right rows correspond to two adjacent slices. A sub-region in BA as located by standard SPM analysis contained large isotropic tensors in the presence of the task (circled region). Around this sub-region, FCTs exhibited high anisotropy during the reading task with major directions forming pathways toward (red arrow) or away from (green arrow) the BA. In contrast, FCTs around the BA in the resting state appeared to be largely isotropic. Inset is an oblique view of the boxed region, which shows multiple layers of highly anisotropic tensors. Also note that the left side of the green box is not adjacent to gray matter.

