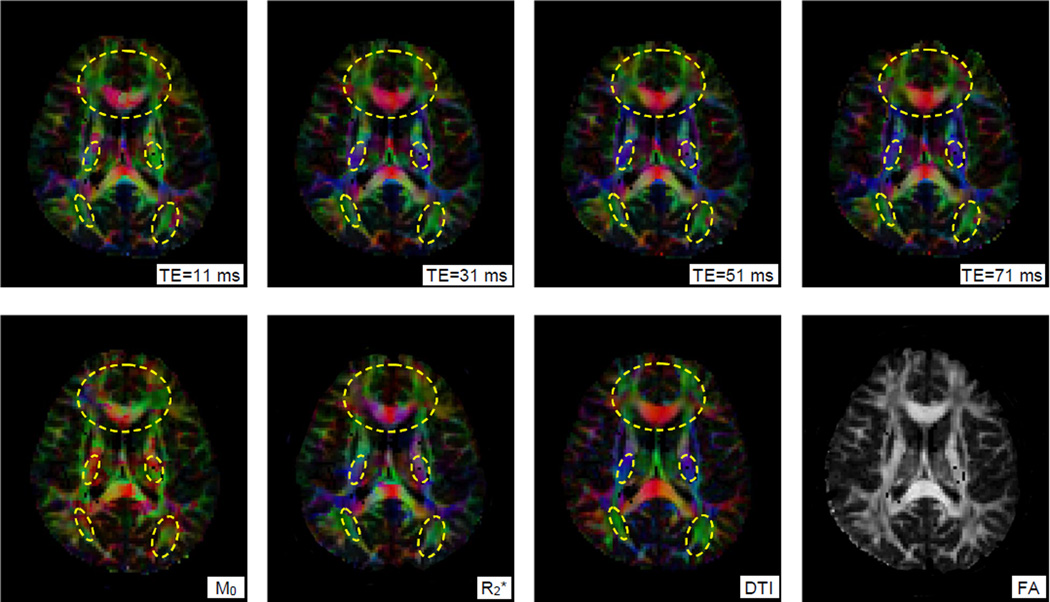
Figure 5. A slice of color-coded functional correlation tensors constructed at different echo times.
From the left to right in the top row are FCTs constructed at four different TEs, and in the bottom row are FCTs constructed from M0 and R2* images, diffusion tensors and a derived FA map. Circled regions show nearly identical anisotropy patterns between FCTs at TE=31 ms and diffusion tensors.

