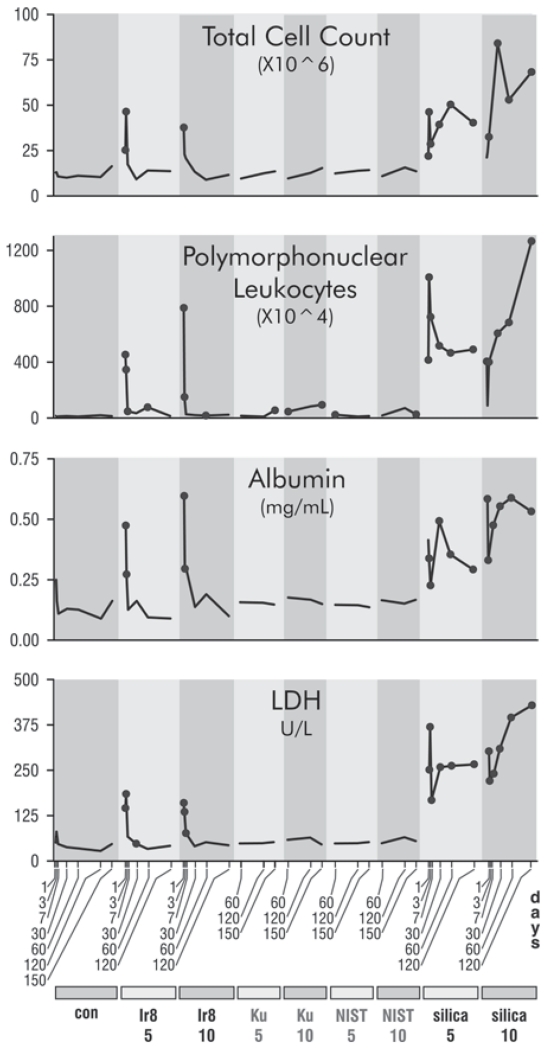
FIGURE 2.
Time courses of responses in BALF to dust instillation. Dots indicate time points that are statistically different from matched controls for each time point at p ≤ .05 in a Kruskall–Wallis test with a Wilcoxon ranks post hoc analysis. No multitest correction was performed. Dusts are indicated at the bottom of the plot, con (PBS control), Ir8 (Camp Victory 2008 dust collection), Ku (Camp Buehring dust), NIST (U.S. urban dust), and silica (silica). The numbers below the dust identifiers indicate the amount of dust exposure (mg/kg bw). Gray dust identifiers indicate data from the comparative experiment and black from the time course experiment. Gray dust identifiers indicate data from the comparative experiment and black from the time course experiment.

