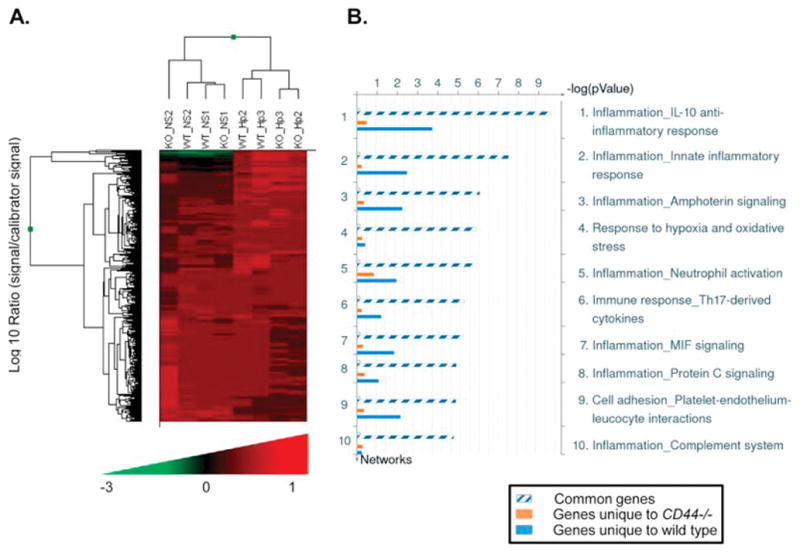
Figure 2. Differential gene profiles in wild type and CD44−/− peritoneal macrophages infected with H. pylori.

Thioglycollate-induced peritoneal macrophages (PM) obtained from wild type or CD44−/− mice were infected with H. pylori at a MOI of 20 for 16h and gene expression profiles determined by microarray analysis. Two mice were analyzed in each group. A. Dendrogram of gene profiles of wild type (WT) or CD44−/− (KO) PMs infected with H. pylori (Hp) or brucella broth alone (NS). B. Distribution of gene networks in which genes unique to WT PM (blue bar), those unique to CD44−/− PM (orange bar) and common genes participate (hatched bar).
