Figure 1.

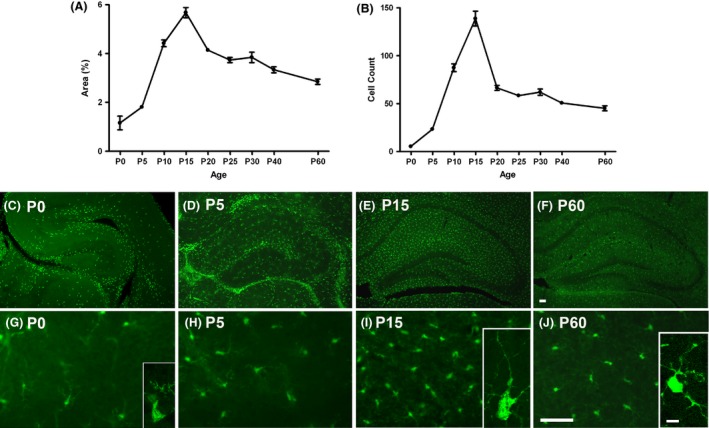
Developmental profile of microglia in mouse hippocampus. A steep rise in microglia occurs in the hippocampus from P0 to P15. The sharpest increase is observed from P10 to P15. There is an abrupt decrease in percent area of fluorescence and in the number of microglia from P15 and P20. (A) Quantification of the mean percent area of Cx3Cr1‐GFP fluorescence above threshold within the CA3 subregion of the hippocampus (n = 3–4/age). (B) Cell counts of microglia within CA3 subregion. (C–J) Representative images of GFP‐labeled microglia in coronal sections of the right hippocampus of P0, P5, P15 and P60 mice. (C–F) Upper panel: 4 × (hippocampus); (G–J) Lower panel: 20× (CA3). Scale bars = 50 μm. (Inset, G I &J) Representative confocal images of individual microglia within the hippocampus. Small cell bodies and poor ramification are noted at P0. At P15, microglia have larger bodies with elaborate processes extending into the hippocampal parenchyma. Microglia at P60 demonstrated smaller somas and fine, ramified branches typical of mature, resting microglia. Scale bar = 25 μm.
