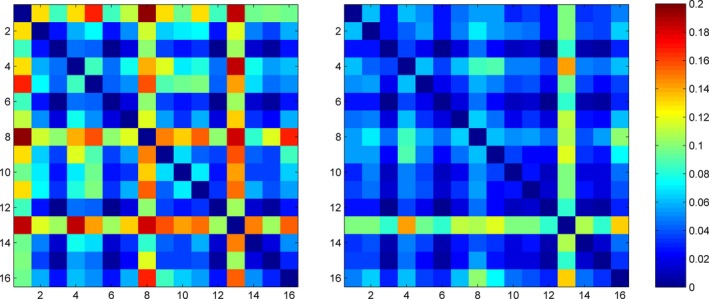
Figure 4.

Pair‐wise distance among the weight vectors across different folds of cross‐validation. The left panel is for the supervised model, and the right panel for the semi‐supervised model. Each panel is a symmetrical distance matrix. The color represents the distance, with hot colors representing large distance values and cool colors representing small distance values. The two panels use the same color scale as shown by the color bar.
