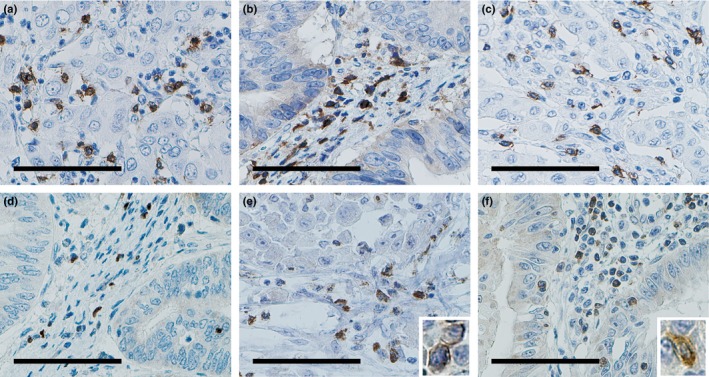
Figure 2.

Immunohistochemical features of tumor‐infiltrating cells. These representative photos show: (a) CD3+ T cells, (b) CD4+ T cells, (c) CD8+ T cells, (d) FOXP3+ T cells, (e) B and T lymphocyte attenuator (BTLA)+ cells, and (f) Casitas–B‐lineage lymphoma protein‐b (Cbl‐b+) cells. Scale bar = 100 μm. High power views are shown in insets of (e) and (f).
