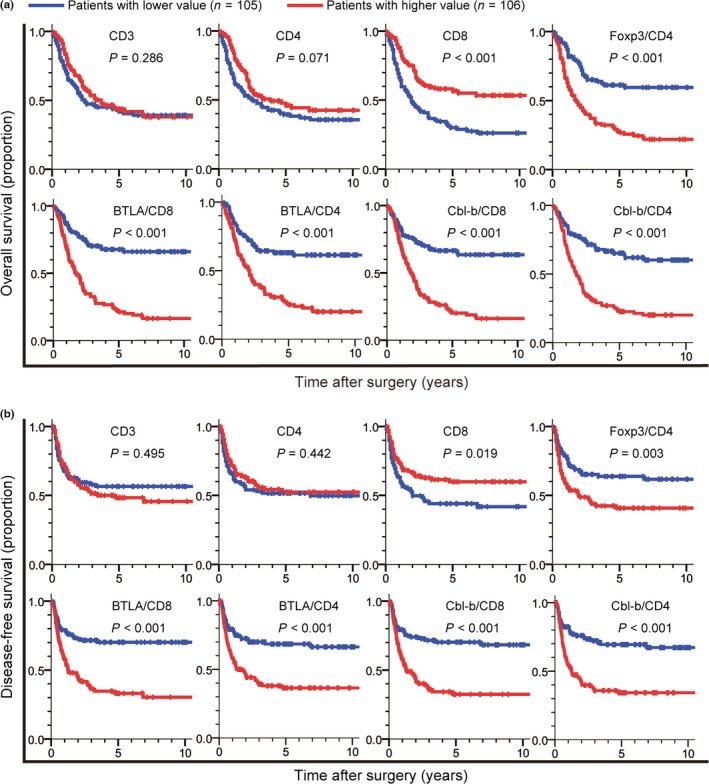
Figure 4.

Kaplan–Meier survival curves comparing (a) overall survival and (b) disease‐free survival in gallbladder cancer patients between the high (red) and low (blue) value groups with regard to the density of tumor‐infiltrating CD3+ T cells, CD4+ T cells, CD8+ T cells and the density ratio of the FOXP3+ T cells to CD4+ T cells (Foxp3/CD4), that of B and T lymphocyte attenuator (BTLA)+ cells to CD8+ T cells (BTLA/CD8), that of BTLA + cells to CD4+ T cells (BTLA/CD4), that of Casitas–B‐lineage lymphoma protein‐b (Cbl‐b)+ cells to CD8+ T cells (Cbl‐b/CD8), and that of Cbl‐b+ cells to CD4+ T cells (Cbl‐b/CD4). P‐values were obtained by log–rank test.
