Figure 2.

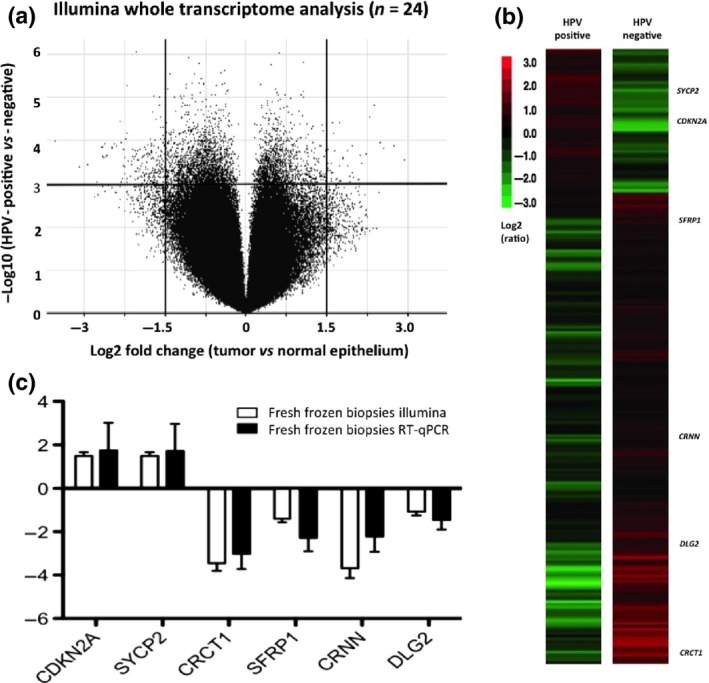
(a) Two‐way anova identified target sequences with significant differential expression between normal and tumor tissue and further stratified by human papillomavirus (HPV) status. In the volcano plot, the x‐axis is the log2 fold change value (tumor vs. normal epithelium) and the y‐axis is the −log10 odds value (HPV‐positive vs. HPV‐negative cohort). The two vertical lines represent 1.5 log2 (×15) fold change as the threshold cut‐off, both downregulated (left side) and upregulated (right side). The horizontal line represents a log odds value, P < 0.01 (false‐discovery rate of 0.5%), as the threshold cut‐off. (b) Hierarchical clustered heatmap of 223 genes displaying significant differential expression. As expected, CDKN2A ranked highly in the full transcriptome analysis. Five other genes that may have clinical relevance in HPV‐positive malignant disease are SYCP2,SFRP1, CRCT1, CRNN, and DLG2. (c) Validation graph for expression analysis (Illumina vs. RT–real‐time quantitative PCR [RT‐qPCR]; Pearson correlation coefficient, r = 0.905; P = 0.013; Kolmogorov–Smirnov test of normality, P > 0.10).
