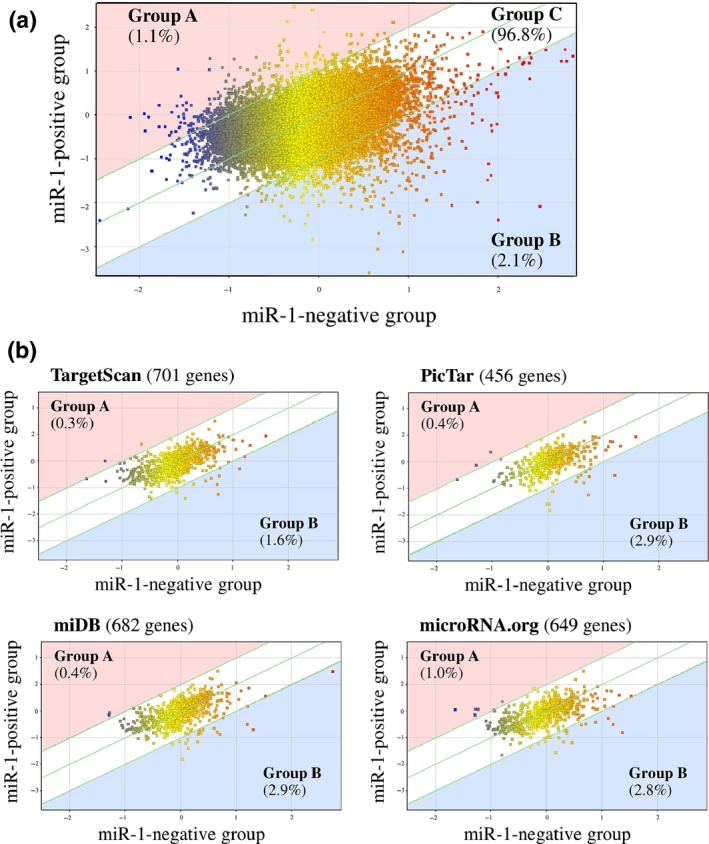
Figure 2.

Scatter plot analysis of microarray data of stage IV breast carcinoma according to the miR‐1 status. (a) whole genes (n = 42 545) and (b) putative miR‐1 target genes predicted by using four target prediction tools. Genes are plotted on the logarithmic graph. Genes those were more than 2.0‐fold higher in the miR‐1‐positive group (n = 3) or miR‐1‐negative group (n = 2) are located outside of the diagonal line, and classified as group A or group B respectively. Genes ≦ 2.0‐fold changes are classified as group C.
